In the quest for knowledge

Semantic_Web_Stack

This week in DITA we have approached the concept of semantic Web.

Even though there is no agreed definition about what Web 3.0 should be, some people consider it as an extension of the Web 2.0 while others identify it with the semantic Web.

The term Semantic Web was coined by Tim Berners-Lee and he gave this definition in the Scientific American article “The Semantic Web” in 2001: “The Semantic Web is an extension of the current web in which information is given well-defined meaning, better enabling computers and people to work in cooperation.

In other words, the idea is to make the Web more intelligent and intuitive about how to serve a user’s needs.

Search engines have little ability to select the pages that a user really needs. The semantic Web aims to solve this problem using context-understanding programs that, through the use of self-descriptions and other techniques, can selectively find what users want. The central idea of it is that data should be not only machine readable but also machine understandable.

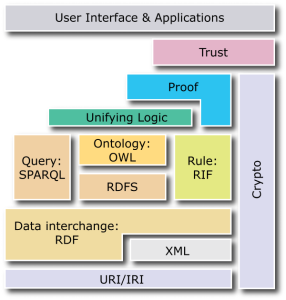
Although the semantic Web does not yet exist, the World Wide Web Consortium (W3C) has identified the technologies needed in order to achieve it and these are four:

  1. Web resources
  2. RDF (Resource Description Framework), which is a general framework for describing metadata on the website. It is written in XML. A RDF statement is a triple which consists of subject (a resource), object (a property of the subject) and predicate (their relationship). URI’s (unique resource identifier) are used for subjects and predicates while objects can use either a URI or a literal such a number or string. Collections of RDF statements are called RDF graphs.
  3. RDFS (Resource Description Framework Schema), which is a language for describing taxonomies based on RDF statements.
  4. OWL (Web Ontology Language), which is a set of logical rules that define relationships among the things described in the taxonomy. It can be expressed as a RDF graph.

A markup language is a computer language that uses tags to define elements within a document. Two of the most popular markup languages are HTML and XML.

The Text Encoding Iniciative (TEI) is ‘an international project to develop guidelines for the preparation and interchange of electronic texts for scholarly research, and to satisfy a broad range of uses by the language industries more generally.’

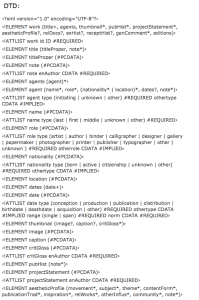
It is based on XML and it requires a DTD (Document Type Definition), which defines the document structure with a list of legal elements and attributes.

It is possible to use a XML existing scheme or to customise a content model. In this last case, it is essential to create clear definitions of what tags describe and how they are going to be used.

The main difference between marked-up text and non-marked-up text is that the former can be analyzed, searched, and put into relation with other texts in a repository or corpus.


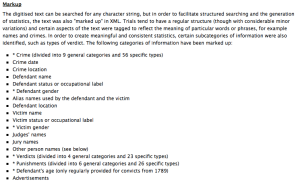
An example of a custom-built tag set is the one used by the Project Old Bailey Online. The project’s web site states clearly the categories that have been marked up:

Captura de pantalla 2014-12-02 a la(s) 15.35.15

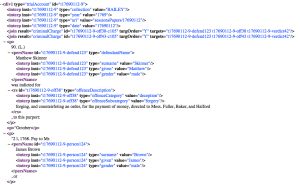
It also allows to have a XML view of the trials:

 Captura de pantalla 2014-12-02 a la(s) 15.39.04


Artists Books Online is another good example of a custom-built tag set. It is an online repository of facsimiles, metadata and criticism.

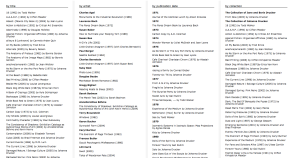
Indexes are organized by title, artist, publication date and collection.

Captura de pantalla 2014-12-02 a la(s) 15.44.49

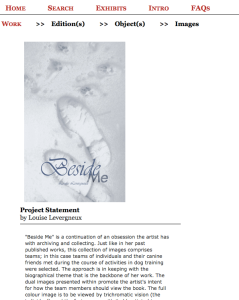
Books are represented by metadata in a three-level hierarchical category structure (work, edition and object) plus an additional level corresponding to images.

Captura de pantalla 2014-12-02 a la(s) 15.46.19

The website allows to access to the DTD, which is a file that defines the kinds of elements, attributes, and features that the data have. In this case, it is organized in the three-level structure mentioned before: work, edition, object. This basic structure is a scholarly convention from bibliographical description.

Captura de pantalla 2014-12-02 a la(s) 15.50.43

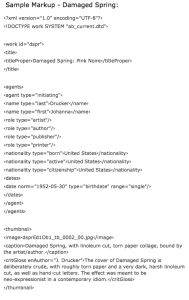
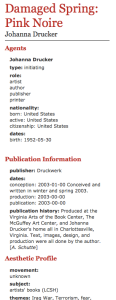
This website also provides a sample XML file of the item “Damaged Spring”, allowing us to compare it with the DTD and with the human readable version.

Captura de pantalla 2014-12-02 a la(s) 15.41.21Captura de pantalla 2014-12-02 a la(s) 15.42.18

————————————————————————————————————————————————–

The FAQs section is helpful and gives an insight of the future plans that the website aims to fulfill.

There are many projects that encode texts using TEI. Some of them can be found in this link. It could also be used in the future to create online repositories of music, video, images and so on.

With this post, we have come to an end to our lectures in DITA. I would like to say that I have found this module very challenging and helpful at the same time, opening my mind to very interesting topics and tools, which I find extremely important in order to cope with the transformations the LIS profession has undergone lately.

Data mining

images

This week in DITA, we have approached the concept of “data mining”. This term refers to the process of analyzing data in search of patterns or relationships in order to extract information from them. In other words, it is the process of extracting new knowledge from sets of data already in existence.

Data mining has been largely used in order to conduct statistical and economic analysis.

In the humanities, data mining is often associated to the term of digital humanities and it combines methodologies from computer science and humanities. It allows to extract information from a body of texts and can be used either to answer questions raised by the researcher or to develop new questions.

Data mining can raise some issues regarding legality. Much of the literature that is used to conduct data and text mining is under copyright. Even though in some countries there are some exceptions to copyright which would allow for content mining, this is not well defined and researchers in some cases are reluctant to carry an activity that could infringe the law.

There are four different tasks usually involved in data mining in humanities. These are:

N-gram Identification: identifying relevant characters or words in a body of texts.

Classification: identifying new classes or categories.

Dependent Modeling: identifying dependency or correlation among variables.

Clustering: identifying new groups or structures in the data.

There are different text-mining tools that can scan content and convert the selected data into a format that is compatible with the tool’s database. This content can be unstructured or structured.

In our Lab exercise about this topic, we have focused in two tasks:

-First, we have analysed Old Bayley Online.

This site provides a digitised collection of the Old Bailey Proceedings from 1674 to 1913, and of the Ordinary of Newgate’s Accounts between 1676 and 1772. The project was grant funded by the Arts and Humanities Research Council, the Big Lottery Fund and the Economic and Social Research Council.

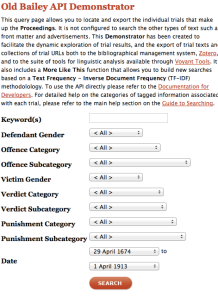
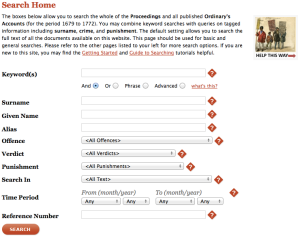
There is an appropriate organization of the information. The text can be searched for character strings. To facilitate structured searching and the generation of statistics, the text was also “marked up” in XML, allowing the search for categories.

This Project resulted in a conference that was held on 5 July 2010 at the University of Hertfordshire. It is related with other two digital projects: a website called “London Lives, 1690-1800: Crime, Poverty and Social Policy in the Metropolis” (launched in 2010) and “Locating London’s Past” (launched in 2011).

The Old Bailey API and the Old Bayley Online search are structured in a similar way. Both of them present similar categories for searching.

Captura de pantalla 2014-11-25 a la(s) 11.02.19

API

Captura de pantalla 2014-11-25 a la(s) 11.02.04

GENERAL SEARCH

—————————————————————————————————————————————————

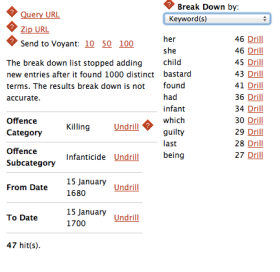
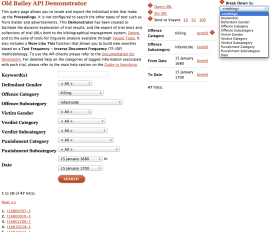
The main advantage of the API is that it allows to explore the results obtained either through modifying the query (undrilling) or through breaking down the results by any of the available sub-categories of tagged data and by all words in each trial.Captura de pantalla 2014-11-25 a la(s) 11.23.14

Captura de pantalla 2014-11-25 a la(s) 11.16.03

Once the results have been obtained, the API gives the possibility of exporting them either to Zotero or to Voyant.

In order to do that, there are three options: to export the results as a ‘Query URL’, a ‘Zip Url’ or to export the full text of all trial results (up to 10, 50 or 100 trials) to Voyant.

Captura de pantalla 2014-11-25 a la(s) 11.36.39

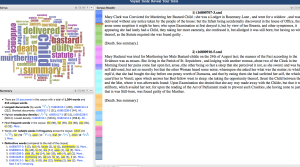
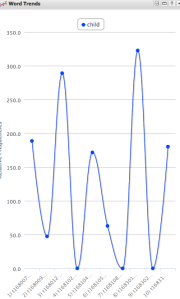
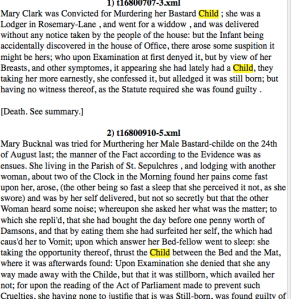
These are the API results exported to Voyant:

Captura de pantalla 2014-11-25 a la(s) 11.42.52Captura de pantalla 2014-11-25 a la(s) 11.43.42

Captura de pantalla 2014-11-25 a la(s) 11.44.00

Word clouds, word trends, keyword frequency, etc help us to extract meaninful information from the texts even though sometimes meaningless results can be obtained.

-Second, we have analysed one of the projects of the Utrecht University Digital Humanities Lab Text Mining Research Projects.

I chose Circulation of Knowledge and Learned Practices in the 17th-century Dutch Republic (CKCC). The aim of this project is to create free, online access to historical sources, open to researchers from various disciplines all over the world.

It studies scholarly letters and it focuses on how the new elements of knowledge were picked up, processed, disseminated and accepted in broad circles of the educated community.

The project was made possible by grants from NWO (the Netherlands Organisation for Scientific Research) and Clarin-NL, and with the support of Clarin-EU. It has resulted in a large number of publications and lectures.

The Epistolarium is a web application wich allows to browse and analyze around 20,000 letters that were written by and sent to 17th century scholars who lived in the Dutch Republic. It also enables visualizations of geographical, time-based, social network and co-citation inquiries.

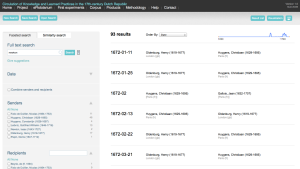
The search interface consists of two parts: The facets (on the left) and the results (on the right):

Captura de pantalla 2014-11-25 a la(s) 12.20.48

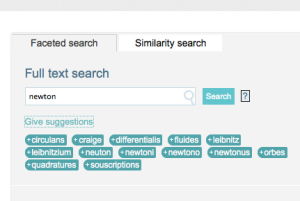
 The first facet is a full text search. Based on a topic model, the ePistolarium can give word suggestions based on the input of the full text searchbox.

Captura de pantalla 2014-11-25 a la(s) 12.24.08

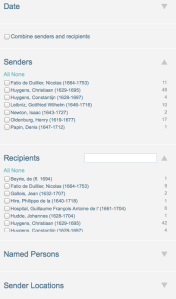
The other facets contain metadata of the letters, like date, senders, recipients, named persons, sender locations, recipient locations or correspondences, that can be used as filters.

Captura de pantalla 2014-11-25 a la(s) 12.28.35

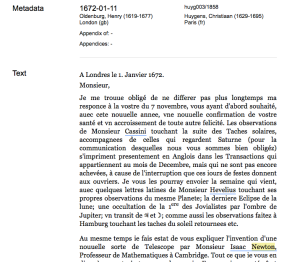
The list of results are displayed on the right side. Clicking on a result item, the full text and metadata of the letter is available, showing the search word highlighted.

Captura de pantalla 2014-11-25 a la(s) 12.32.02

It also gives the possibility of sharing the letter via email, Facebook and Twitter .

Captura de pantalla 2014-11-25 a la(s) 12.34.39

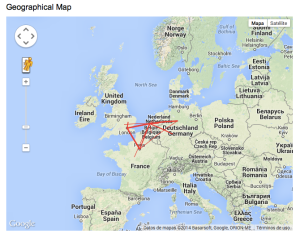
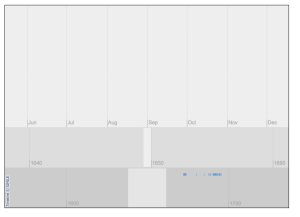
A result list can be visualized on a timeline, map or network graph.

Captura de pantalla 2014-11-25 a la(s) 12.38.05

Where the letters came from and where sent to

Captura de pantalla 2014-11-25 a la(s) 12.38.38

The letters spread over time

Captura de pantalla 2014-11-25 a la(s) 12.38.51

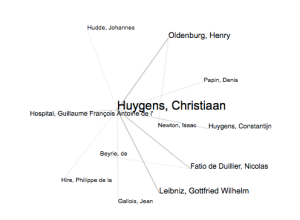
Who wrote to whom

Captura de pantalla 2014-11-25 a la(s) 12.39.07

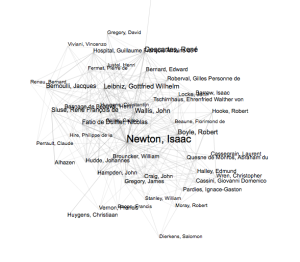
The persons mentioned in the letters.


 There is also the possibility of calculating the similarity between an arbitrary text and letters in the corpus and of saving and retrieving search queries.

“So many books, so little time”

280532292_847057026a_z

This quotation is taken from a book called The Hermeneutics of Screwing Around; or What You Do with a Million Books by Stephen Ramsay and it seems appropriate to introduce this week’s DITA new topic: Text Analysis.

The idea behind this quote is that there is not enough time in the life of a person to go through all the existent literature or information published even in a specific topic. We are only able to manage an infinitesimal fraction of the information that exists about a subject.

To cope with this problem, the Italian scholar Franco Moretti proposes a method called ‘Distant reading’. Instead of studying particular texts (close reading), we should analyse massive amounts of data. We should take a vast amount of literature or information and feed it into a computer for analysis. According to him, this is the only way to uncover patterns. Computers can’t read but they are good at searching for specific information and finding patterns. The truth can best be revealed through quantitative models.

One of the ways to explore information in this way is using text analysis. According to Geoffrey Rockwell, text analysis allows us to search large texts quickly; to conduct complex searches and to display the results in a different number of ways. “It’s a way to tell a new story”.

To understand how text analysis works, we have used three different tools: one more basic (Wordle) and two more advanced (Many Eyes and Voyant Tools). With them, we have analysed datasets created previously in other sessions using TAGS and Altmetrics.

Wordle is a basic tool that generates word clouds from a text. A word cloud is a visual representation of keywords from a text, giving more prominence to the ones that appear more frequently. Wordle allows to personalize the clouds obtained with different layouts, colors and fonts.
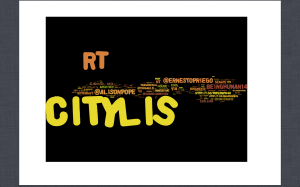
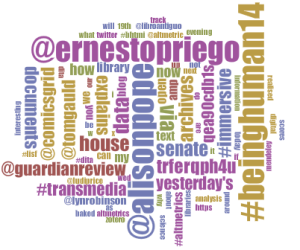
These are two examples of word clouds created with data exported from TAGS (Twitter data from #citylis) and Altmetrics (publications with articles about ebola):

Captura de pantalla 2014-11-19 a la(s) 12.21.31Captura de pantalla 2014-11-19 a la(s) 12.27.36

The fact that this tool does not allow to include “stop words” has as a consequence that in the word cloud are present some irrelevant words such as “citylis, rt, mt, post” in the first case or “of” in the second case.

 Voyant is a more advanced tool. It is a project by Stéfan Sinclair and Geoffrey Rockwell and it is still in progress. It enables to work with a wide variety of formats, to upload files and to use stop words. Another advantage is that apart from word clouds, other types of text analysis are possible: lists of words and their frequencies; graphs; etc.

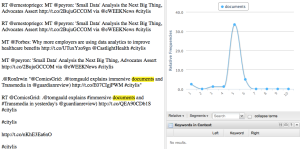
Using one of the previous datasets, this is the word cloud obtained with this tool, using stop words:

Captura de pantalla 2014-11-19 a la(s) 13.43.26It gives also the opportunity of locate words in the text and show their frequency in a graph:

 Captura de pantalla 2014-11-19 a la(s) 14.00.45

There is also a word list that help identify the nature of the text, performing in this way a qualitative analysis of the data.

Tools like these have led to the emerging of a new discipline called Digital Humanities. This discipline uses information technology to conduct the analysis of different materials throughout the humanities disciplines.

Alternative scholarly impact metrics

índice

This week in DITA we have approached the concept of Altmetrics and we have used the Altmetric Explorer to explore and obtain bibliographic and social media data.

Let’s start trying to define what altmetrics are.

Traditionally, in order to evaluate research impact, the most common thing was to pay attention to the number of times a research article was cited by other articles. But citations are not the only way to measure this impact.

As an alternative to only use citations, new ways of measuring have arisen: pages views, downloads counts, mentions in Wikipedia or in blogs, etc. These metrics can be considered alternative metrics of impact.

Altmetrics offer advantages and disadvantages. On the one hand, they show us the scholarly articles that are read, saved and discussed as well as cited and, on the other hand, the evidence of their impact on diverse audiences. Nevertheless, they don’t provide reliable metrics. They are prone to gaming and other mechanisms to boost one’s apparent impact.

There are different almetrics tools but we have focussed on Altmetrics.com. This tool searchs and measures academic articles focussing on the online attention that they have attracted. It is used by publishers, institutions and researchers.

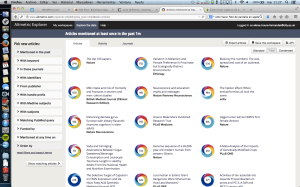
The Altmetrics Explorer uses a small donut to convey information about each article. There is a number in the centre of the donut which is called the Altmetric Score and this is the measure of the attention that a scholarly article has received. It is obtained juggling three different factors: volume, sources and factors. The colours of the donut reflect the different sources: blue for Twitter, yellow for blogs, red for mainstream media sources, etc.

In order for this tool to work, the documents need a DOI, which stands for digital object identifier. It can be defined, according to Wikipedia, as a character string used to uniquely identify an object such as an electronic document. Metadata about the object is stored in association with the DOI name and this metadata may include a location, such as a URL, where the object can be found.

Reports are available in a machine-readable version as JSON but they can be exported as a CSV file and opened on Excel.

As an example, this is how it looks data obtained using the Altmetric Explorer:

Captura de pantalla 2014-11-11 a la(s) 11.27.21

DESCRIBING DATA

data_path_with_glow_by_roos_skywalker-d5ju49z

This week’s DITA topic has been an introduction about XML and JSON. API designers use these two formats for exchanging data between their servers and client developers.

XML stands for Extensible Markup Language. It was designed to describe data and basically is information wrapped in tags. It is not a replacement for HTML but a complement to it.

While HTML displays data and allows only to use the tags that are already defined in the HTML standard, XML describes data and allows us to define our own tags. The tags and the document structure can be created by the author of the XML document.

The data in XML is stored in plain text format which makes it much easier to create data that can be shared by different applications. It makes the data more available.

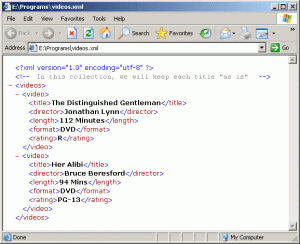
This is an example of a XML document:

preview7

XML documents form a tree structure. They contain a root element which is the ‘parent‘ of the other elements. The terms ‘parent, child, and sibling‘ are used to describe the relationships between elements.

In our example, the root element is ‘video’ and this root element has five ‘children‘ who are ‘title, director, length, format and rating’.

JSON stands for JavaScript object notation which is a syntax for storing and exchanging data. It is a lightweight data interchange format. It shares some characteristics with XML (plain text, self-describing, hierarchical) but JSON is faster and easier. It doesn’t use end tags, it is shorter and easier to read and write. While XML is document-oriented and a better document exchange format, JSON is data-oriented and a better data exchange format.

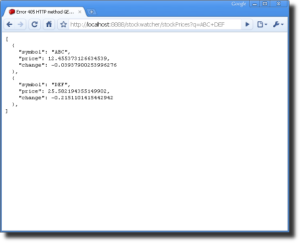
JSON data is written as name/value pairs. A name/value pair consists of a field name (in double quotes), followed by a colon, followed by a value (also in double quotes).

Curly braces hold objects which can contain multiple name/values pairs and square brackets hold arrays which can contain multiple objects.

This is an example of JSON, in which we can see one array which holds two objects, each one of them holding three name/value pairs:

JSONdata

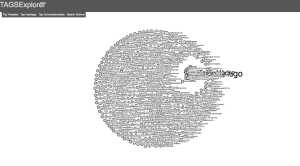
This week, we have also used a Twitter Archiving Google Sheet (TAGS), which is a mashup using the Twitter search API and Google’s API, created by Martin Hawksey. This is a tool to collect data and their related metadata from Twitter.
These are some results obtained from #citylis in Twitter:

Captura de pantalla 2014-11-19 a la(s) 15.48.09

About APIs and Mashups

4053393372_9dc3fc7316_z

In our third session in DITA we have discussed the concept of web services and API’s.

API stands for application programming interface. An API can be defined as the interface implemented by an application which is used by other applications to communicate with it. An API is not a user interface but a software-to-software one. It makes possible that applications can talk to each other. There is no need of user knowledge or intervention to accomplish this task.

As an example, when you shop online and enter your credit card information to make the payment, the website, through an API, sends your details to another application which verifies that they are correct. Once they are verified, this application sends the confirmation to the former website in order to proceed with the purchase.

According to Jason Paul Michel, an API is a set of methods to access data in otherwise closed systems. It gives to programmers and developers the tools necessary to build software and services with data and services from external sources.

APIs are considered to be gateways to web-based services. They let data in and out of a web service. This request-response message system is typically expressed in XML or JSON.

APIs can be really important for libraries in the sense of allowing them to integrate with prominent web services.

Once we have establish what is an API, we can say that web services are API’s that have been designed for specific web applications.

When we use data and services from APIs and web services to produce enriched results and display them in a single new service, we have a mashup. A language called Java Script allows functions from one website to be included in another. This allows to create an ecosystem based on openness and sharing, where users are able to contribute.

As an example of how to embed content in a post, I have chosen to publish here a map with some important libraries that we can find in London.


And I have also embedded a twitter about API restrictions explained by Hitler


Finding information

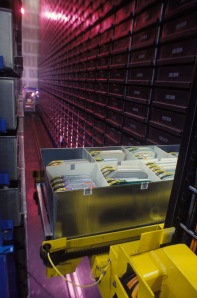
The inside of an ASRS at the Defense Visual Information Center

In my first post I talked about how an information architect organizes and labels websites in order to support users. So, let’s start asking why do we organize things? What is the purpose in systematizing things?

We can say that the main reason behind that is to be able to find and retrieve things when we need them without great difficulty. And this leads us to the new topic we have discussed in DITA this week: information retrieval systems and databases.

As Chowdhury states in Introduction to modern information retrieval, an information retrieval system is designed to enable users to find relevant information from a stored and organized collection of documents.

The term database is used to design in general any collection of digital information.

Database management system (DBMS), Relational database management system (RDBMS) or Extensible Markup Language (XML) are systems that handle structured data, normally in the form of numbers or short pieces of text. They group data elements into defined structures and represent them as tables. A structured query language (SQL) is used to search into these tables. Results are always exact matches.

As opposed to the previous ones, information retrieval systems are those which deal with unstructured data (usually text) and try to retrieve the information that fully or partially match the user’s query.

IR systems present four main components: input; indexing; search and interface.

  • The input supplies the stored and potentially retrievable data: whole documents; bibliographic references; images, etc…

  • The indexing system is a process of translating a document into a set of relevant keywords. It creates a file of index terms, an inverted file structure with pointers from each term to the documents to which it applies.

  • The search component is the most important one because is the responsible for the work of retrieval. There are three classic information retrieval models: Boolean; vector space and probabilistic. They are methods to establish the degree of relevance of the user’s query with respect to the document representation. This matching process is expected to produce a ranked list of documents. The Boolean model provides always exact matching while the other two are described as ‘best match’.

  • The interface component helps users to understand and express their information needs, to put their query to the system and collect the results when the process ends. There are three groups of information needs:

       –informational queries, where users look for a specific topic.

       –transactional queries, where users carry out a transaction.

      –navigational queries, where users navigate for a specific site looking for information.

  • Among the different interface styles, the command line, the search box and the advanced search are perhaps the most important ones. A command line interface allows the user to interact with the computer by typing in commands. It can be difficult to use for an inexperienced user because of the number of commands that have to be learnt. At the opposite extreme, the search box allows users to type whatever they want. Finally, the advanced search is a combination of the previous interfaces.

The evaluation of an information retrieval system consists in assessing how well this system meets the information needs of its users. The most common used metrics are recall and precision. Recall is the fraction of the documents relevant to the query that are successfully retrieved while precision is the fraction of retrieved documents that are relevant to the query.


Information retrieval systems have enabled easier and faster information discovery and it is a fact that they will play an increasingly important role in the future due to the exponential growth in the amount of information.

Looking into Information Architecture

inf

The purpose of setting up this blog is to have a space to reflect on some of the topics I have come across in Digital Information Technologies and architectures (DITA), which is one of the modules of the MSc in Library and Information Studies that I am currently studying.

As you can see, I have named my blog “Building Bridges” and for my tagline I have chosen “Connecting users and contents”. This title is meant to refer to the main reason why information architects exist. And this is the topic about I would like to write in this first post.

What is information architecture? And which is its role in today’s world?

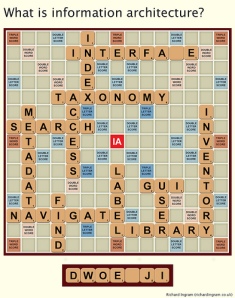
Information architects try to establish a structure in the website that helps users to locate contents, according to their needs. In other words, an information architect organizes and labels websites in order to support users. They produce the taxonomy of how content should be classified.

According to the book “Information and architecture for the World Wide Web” by Peter Morville and Louis Rosenfeld, a well-designed information architecture should be invisible to the users.

These authors establish that there are four categories of components that information architecture should necessarily deal with and these are: organization systems, labelling systems, navigation systems and search systems.

  • Organization systems refers to the need to present the content in different ways; to provide multiple ways to access the same information.
  • Labelling systems revolves about the idea that information architects should try their best to design labels that speak the same language as a site’s users while reflecting its content. The contents should have meaning for the users.
  • Navigation systems refers to the need to help users move through the content. A well-designed taxonomy will reduce the chances for users to become lost.
  • Search systems allow users to search the content, to go directly to the information they are looking for. This is accomplished through a search box. Search usually helps when you have too much information to browse.

All of these components will help users to have a better experience when browsing a website.

Thinking about the role that information architecture fulfils today, it is necessary to say that the appearance of the World Wide Web has changed the world. There are billions of web pages and information architecture is present in every one that exists. All of them have labels, indexes, taxonomy, metadata…

Most large organizations have already teams of information architects to design their websites. As web sites become more sophisticated, information architects are more needed.

With the massive amount of digital information, information architecture has become essential to ensure people can access what they need when they need it.